Keep recordings locally, forward traces to a collector or Langfuse, or use both. These are separate options; neither is needed to run an agent.
Recording, trace export and content capture are independently configurable.
What you can inspect
| View | What it answers |
|---|---|
| Run search | Which session or run should I investigate? |
| Session turns | What happened after each user message? |
| Execution tree and waterfall | Which model call or tool took time, failed or retried? |
| Step details | What usage, outcome and permitted input/output belong to this step? |
| Child navigation | What did a delegated agent do? Open its session and return through the parent breadcrumb. |
The management UI provides these views for an authenticated service. Applications can also query recordings or embed the optional trace viewer. No UI dependency is added to the core runtime.
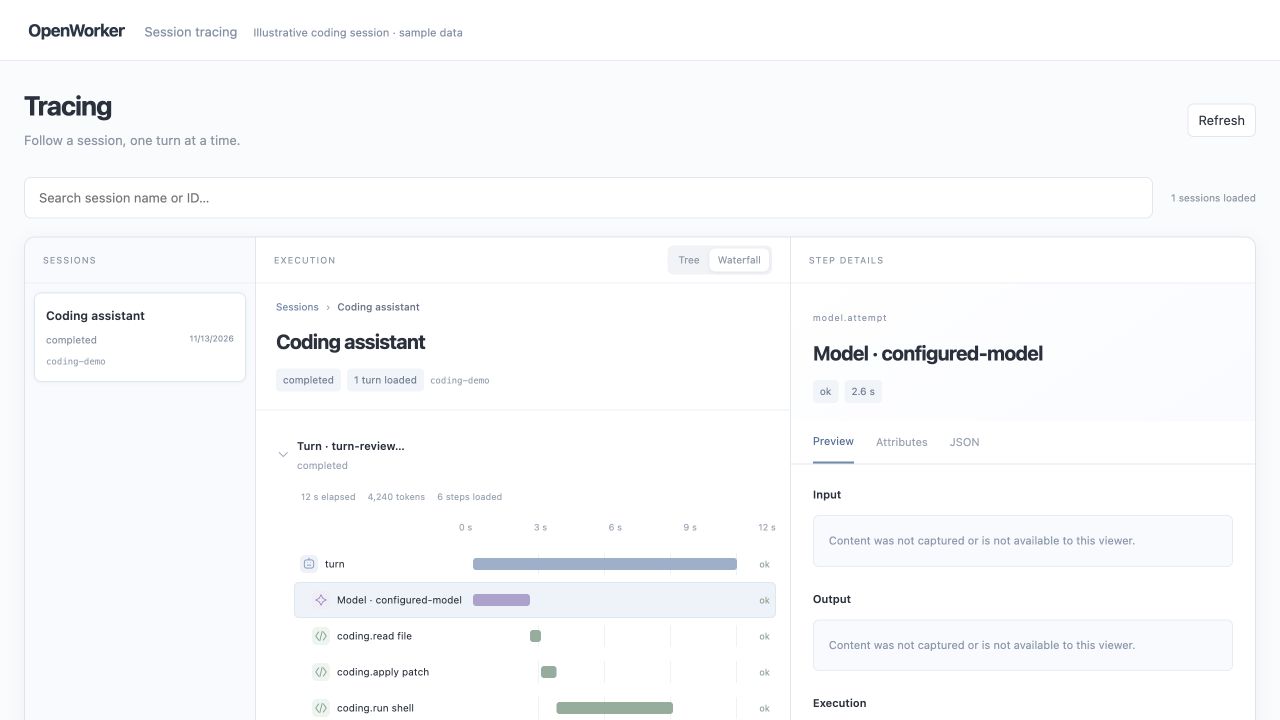
The tracing component with synthetic sample data. Content capture is off.
Record locally
Use a recording database separate from execution storage. Content capture is off; timing, outcome, usage and identifiers are enough for most product dashboards.
import {Harness} from '@openworkerai/harness-sdk';

const harness = await Harness.start({
  stateDir: '/absolute/private/app/state',
  recording: {
    database: {type: 'sqlite', path: '/absolute/private/app/observations.sqlite'},
    retentionDays: 30,
    queueCapacity: 1024,
  },
});
// Create/run your agent as usual; then query its accepted turn.
await harness.observability.flush(5000);
const turns = await harness.observability.listTurns({sessionId});
if (!turns.turns.length) throw new Error("No recorded turn to inspect");
const query = {sessionId, turnId: turns.turns[0].turn_id};
const timeline = await harness.observability.timeline(query);
const summary = await harness.observability.summary({...query, through: timeline.page.through});
Rust uses Harness::builder().recording(RecordingConfig::sqlite(path)) and
harness.observability().timeline(TraceQuery::turn(session_id, turn_id)).
Enable Cargo feature recording; add recording-postgres for PostgreSQL,
evaluations for durable results, and evaluation-export for background score
delivery. otlp is a separate default feature; default-features = false removes
it alongside default guardrail/compliance implementations. No UI dependency is
added to the runtime. Standard packaged binaries include optional capabilities,
but recording, evidence and evaluation delivery remain disabled until configured.
For PostgreSQL use a second connectionEnv and schema under
recording.database: {type: 'postgres', connectionEnv: 'OBSERVABILITY_DATABASE_URL', schema: 'ow_observability'}. The execution and recording connections may point to
the same server or different servers. Run the explicit Rust
RecordingConfig::migrate_postgres().await setup operation before startup.
Production connections verify TLS; loopbackPlaintext is only for local fixtures.
Turn-list cursors refer to execution events; timeline cursors refer to recording
rows. Follow next_cursor even if a bounded turn-list page contains no turns.
Timeline through aligns reads to a watermark, not a cross-request transaction.
A flush is a bounded barrier, not a guarantee that previous dropped records were
recovered. Check health() counters for drops, write failures and export failures.
Export traces
import {langfuseTelemetry} from '@openworkerai/harness-sdk';

const telemetry = langfuseTelemetry(
  'https://your-langfuse.example/api/public/otel',
  'LANGFUSE_AUTHORIZATION',
);
const harness = await Harness.start({ telemetry });
// The environment value is
// "Basic " + base64(publicKey + ":" + secretKey), stored only in the backend.
The helper selects Langfuse v4 trace acknowledgements and metadata-only capture.
For a standard collector, set telemetry.endpoint to its OTLP HTTP base URL and
use the default otlp acknowledgement mode. Do not install a second exporter over
the same event stream. Rust has the matching TelemetryConfig::langfuse helper.
See storage and collector setup.
Use Langfuse’s public API for downstream analytics. Traces are best effort, not a billing ledger. Cached input and reasoning tokens are subsets; never add them again to input/output. Missing usage is unknown. Tool duration and result bytes do not imply exact token cost per tool. Export failure must never trigger replay of a tool or agent turn.
Inspect a turn and its children
Local SDK queries and service.observability share timeline/summary shapes. The
service checks access against execution storage before and after recording reads.
It authorizes every child independently; parent visibility grants no child access.
children(query) returns durable spawn links, including child_turn_id when the
first task was accepted. subtreeSummary(query) counts the root plus visible
spawned initial turns, bounded to 25 scopes. Cycles are deduplicated. Later inbox
turns remain separate. The response names the selected runs and any truncation;
concurrent tasks have no single wall elapsed duration.
The optional trace viewer provides Usage/Timeline views, model/tool groups, child navigation and basic score display. Your app supplies an authorized browser adapter. Do not put SDK, database or exporter credentials in the browser.
Advanced: evaluation records, delivery and audit evidence
These APIs store results supplied by your application. They do not run judges or provide a cluster evaluation UI.
Record evaluations
Enable recording.evaluations: true, then submit results from your app or evaluator:
const recorded = await harness.observability.recordEvaluation(query, {
  id: 'quality-review-1', name: 'correctness',
  evaluator: {name: 'answer-check', version: '1', source: 'code'},
  status: 'completed', score: {type: 'boolean', value: true},
  createdMs: Date.now(), datasetCase: 'case-42', experiment: 'candidate-a',
}, modelSpanId);
Use a stable ID and original timestamp when retrying the same result. Identical
writes return the existing record; conflicts fail. Corrections append a new ID
with supersedes referencing the old result. skipped and error have no score.
Model evaluators may attach their own model/usage; it is not added to agent usage.
This feature records results; it does not run judges or incur model charges.
To deliver results automatically, configure recording.evaluationSinks:
const evaluationSinks = [{
  name: 'langfuse', url: 'https://your-langfuse.example',
  authorizationEnv: 'LANGFUSE_AUTHORIZATION',
  includeExplanation: false,
}];
The separate durable queue retries scores with the same ID/name/timestamp, never
traces or original actions. Delivery depends on destination idempotency semantics;
unknown acknowledgements are not proof of failure. Lease/backoff survives restart.
A sink name binds to its configuration; use a new name for a different destination.
maxPendingEvaluations defaults to 10,000; delivered retained results do not use
pending capacity. evaluationRetentionDays defaults to 30 and pruning protects
undelivered rows. Keep the recording database to resume pending delivery. Shutdown
is bounded and may leave pending scores for the next host start. Scores without a
recorded trace target and skipped/error results remain local and are explicitly
counted as not exportable. Explanations are excluded remotely unless opted in.
For caller-controlled one-shot export, import exportLangfuseScore from
@openworkerai/harness-sdk/evaluation-export. It does not retry uncertain responses.
Choose automatic or caller-controlled delivery for each destination.
Evidence and audits
Set recording.evidence only when content is needed: userInput, assistantOutput,
toolArguments, toolResults, and maxBytes (256–65,536). evidence(query) projects
selected committed events, applies best-effort secret redaction, and reports fields
omitted for size. It excludes failed-attempt deltas, hidden reasoning and blocked
output. Current-turn input is available; historical input is not reconstructed.
Execution event IDs are separate from recording cursors.
evidenceJsonl in the optional export subpath combines authorized timeline,
summary, evaluations and explicitly supplied content with a versioned manifest,
selection, watermark and checksum. It covers only supplied pages, not all history.
It includes no content unless the caller supplies it. Keep expected answers and
rubrics in your dataset keyed by datasetCase; never inject them into the tested
agent. Artifact revisions can be included through selected tool results or your
application’s evidence records. Checksums do not establish completeness or
administrator-resistant integrity.
Use the included session/turn/event references and configuration digests to join existing compliance records and SIEM delivery. Compliance records remain the authority for approvals and effects; traces and evaluations are not proof of compliance. A metadata reader is not a content auditor. In server apps, authorize evidence access separately before returning it, and keep database/host APIs in the trusted backend. The service’s existing compliance content permission continues to control audit reads. Cluster experiment/review tooling comes later.
Manage recording on a service cluster
The source CLI supports independent UI and trace-storage controls:
owcluster observability enable --state ./deployment-state/installation --retention-days 14
owcluster observability status --state ./deployment-state/installation
owcluster observability disable --state ./deployment-state/installation
owcluster management-ui enable --state ./deployment-state/installation
Use the installer state created by owcluster deploy aws up or owcluster deploy azure up.
Enabling recording initializes its separate PostgreSQL schema before workloads
restart. Disabling stops collection after the rollout and retains stored traces;
it does not disable security audit or a separately configured exporter.
See the deployment configuration and private UI access
for the required pinned UI image, CA, database Secret and enable/disable options.